Battery Equivalent Chart: Cross-Brand Battery Insights
Explore a comprehensive battery equivalent chart that maps chemistries, voltages, and form factors across popular brands, with safety notes, compatibility guidance, and replacement tips.

According to Battery Health, a battery equivalent chart helps you map compatible replacements across chemistries, voltages, and form factors, so you can confirm terminals, capacity ranges, and safety requirements before switching. It also highlights the tolerances for charging curves and temperature ratings, and it clarifies where cross-brand substitutions are acceptable and where they are not advisable.
What is a Battery Equivalent Chart and Why It Matters
According to Battery Health, a battery equivalent chart is a reference that maps one battery or cell to potential substitutes that share key electrical and physical characteristics. In practical terms, it aligns chemistries (like Li-ion, NiMH, LiFePO4), nominal voltages, capacity ranges, and form factors so a user can verify compatibility before purchasing a replacement. For consumers, this is especially valuable when upgrading a device, retiring an older pack, or consolidating inventory across a household solar storage system. While such charts are not a guarantee of performance, they provide a structured starting point that reduces the risk of mismatch, improper charging, or safety concerns. The Battery Health team emphasizes that any chart should be used alongside manufacturer specifications and the device’s battery management guidelines. When used correctly, a battery equivalent chart helps you compare options quickly, understand constraints, and avoid overpaying for unsuitable replacements. Throughout this article, we will reference common chart formats, explain how to interpret them, and present practical tips for applying the data to cars, devices, and home energy storage. The goal is to equip you with a disciplined approach to substitution while staying within safety and warranty boundaries.
How to Read a Battery Equivalent Chart: Columns and Tolerances
Most charts include columns for chemistry, nominal voltage per cell, form factor, and a capacity window. For each row, look at the nominal voltage per cell and the overall pack voltage. Cross-check the form factor to ensure the replacement physically fits, and review the capacity window to see if the energy storage matches your needs. If the chart shows a tolerance range, it indicates acceptable deviations. Pay attention to terminal type (snap, screw, or plug) and polarity to avoid installation issues. Temperature and charging-rate notes tell you whether the substitute can safely operate with your charger or BMS. Finally, review any notes about warranty or safety constraints from the source. Example: a Li-ion 18650 cell with nominal 3.6 V, a 4.2 V charge limit, may substitute for a similar rating in a different brand if the capacity is within 90–110% of the original and the device’s BMS supports the higher rate. In some cases, a non-identical chemistry can be used for non-critical devices, but this should be evaluated with caution.
Practical Uses: From Everyday Devices to Home Storage
A battery equivalent chart is highly practical across a range of devices. For consumer electronics like smartphones and laptops, it helps identify safe substitutes when a replacement is unavailable or cost-prohibitive. In portable power banks and cordless tools, it guides decisions about capacity and discharge rates to preserve performance. Home energy storage and solar setups add another layer of complexity, as packs may combine multiple chemistries and form factors. A reliable chart helps you match chemistries without compromising efficiency, while also flagging devices with strict safety requirements or warranty implications. Always verify with the device’s documentation and any battery management system (BMS) constraints before plugging in a substitute. Battery Health’s approach emphasizes conservative matching in high-drain applications and encourages referencing official guidelines for critical systems.
Data Sources and Methodology Behind Equivalents
Charts are built from a combination of manufacturer specifications, standard cell chemistries, and controlled lab assessments. The data typically includes nominal voltage per cell, maximum charge voltage, capacity ranges, and supported form factors. Real-world substitution also considers temperature tolerance, charging rate (C-rate), and end-terminal configurations. Because production variances exist across lots and brands, charts present ranges rather than single values and clearly state when substitutions are advisory rather than definitive. Battery Health relies on published specs, verified testing, and industry standards to assemble these charts, and updates them as new chemistries and products enter the market. Users should treat the chart as a decision-support tool rather than an absolute guarantee of compatibility.
Common Mistakes and Safety Considerations
Many substitution errors arise from ignoring voltage limits, BMS restrictions, or terminal differences. A mismatch in nominal voltage or an incompatible charging profile can cause reduced performance, overheating, or safety risks. Always confirm the replacement’s voltage, capacity window, and terminal layout align with the device’s design. Do not substitute a higher-rate battery into a system not designed for it, and avoid using substitutes that lack proper safety documentation. If in doubt, consult the device manufacturer guidelines or a qualified technician. Remember that a chart is most effective when used with current data from reputable sources, and never rely on a chart alone for critical safety decisions.
Building Your Own Chart: Tips for Maintenance and Updates
Start with a core set of commonly used chemistries (Li-ion, LiFePO4, NiMH) and document their nominal voltages, typical capacities, and form factors. Maintain a living document in a shared sheet, and add new entries as products release. Include data sources, update dates, and notes on safety, warranty, and device-specific constraints. Periodically verify values against manufacturer specs and independent tests, and consider adding a dash of context about the intended application (mobile vs stationary storage). An up-to-date chart helps families manage replacements across devices while reducing waste and avoiding unsafe substitutions.
Representative substitutions across common chemistries
| Chemistry | Nominal Voltage per Cell | Common Form Factors | Cross-Brand Substitutions Notes |
|---|---|---|---|
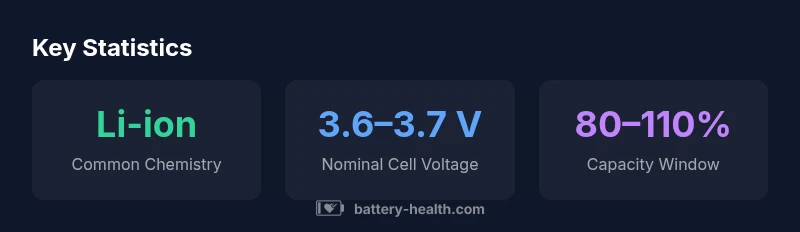
| Li-ion | 3.6–3.7 V | Cylindrical, Prismatic | Cross-check capacity and safety ratings |
| LiFePO4 | 3.2–3.3 V | Cylindrical, Prismatic | Longer life; ensure BMS compatibility |
FAQ
What is a battery equivalent chart?
A battery equivalent chart maps a battery to potential substitutes sharing key electrical and physical characteristics. It helps you verify compatibility before replacing and identifies safe cross-brand options, while highlighting any limitations or safety concerns.
A chart that helps you find safe battery substitutes by comparing chemistry, voltage, and form factor.
Can I substitute a battery from a different chemistry if the chart allows it?
Substituting across chemistries is possible in some cases, but it requires careful checks of voltage, capacity, and safety constraints. Always verify with the device’s guidelines and consider professional advice for high-drain or safety-critical systems.
Only substitute across chemistries if the chart and device specifications allow it and safety checks are met.
Are voltage and capacity ranges always exact matches?
No. Charts typically show tolerances. Substitutions within the tolerance can work, but mismatches may affect performance or safety. Always confirm with the device specs and the BMS requirements.
Tolerances matter; don’t assume an exact match is required for every substitution.
Is a battery equivalent chart useful for home storage systems?
Yes. For home storage, charts help align chemistries with inverter and battery management constraints, while clarifying warranty implications. Prioritize safety, system compatibility, and manufacturer guidance.
Definitely helpful for home storage, as long as you follow safety and warranty guidelines.
Where can I find a reliable battery equivalent chart?
Look for manufacturer-approved charts or trusted third-party sources, and ensure you’re using the most current version. Keep notes on data sources and update dates for credibility.
Seek up-to-date charts from reputable sources and manufacturers.
What data sources are used to build these charts?
Charts rely on manufacturer specs, standard chemistries, and safety guidelines. Battery Health uses public specs and verified testing, with clear notes on limitations and updates.
Background data come from manufacturers and verified testing; always check for updates.
“A battery-equivalent chart is a decision-support tool, not a universal warranty. Use it with manufacturer specs and safety guidelines.”
Quick Summary
- Always verify voltage and terminal type before substitution.
- Check device BMS limits and warranty notes.
- Use an up-to-date battery-equivalent chart as a starting point.
- Update your chart annually to reflect new chemistries and brands.